Santa Clara Home Values - 4 Key Real Estate Trends For Townhouses - Nov 17, 2025
- For Sale
- Juliana
- Buying
- Homes For Sale
- Agent Commission
- Should I Buy A Home Now
- Preemptive Offer
- Buyer Endorsements
- Buy & Sell At Same Time
- Buying A House
- Real Estate Seminar
- Choosing A Buyer Agent
- Closing Escrow
- Contingencies
- Eichler Homes
- 10 Escrow Questions
- FAQ
- Hire The Best
- Home Buying Fears
- Moving Day Checklist
- Negotiating
- New House vs. Old House
- Rent vs. Buy
- Ways To Hold Title
- Wire Fraud
- Zillow
- Selling
- Cities
- City Information
- Real Estate Trends
- Home Values
- Just Sold
- Silicon Valley Trends
- San Mateo County
- Santa Clara County
- Alameda County
- Zip Code Index
- Zip Code Map
- Information
- Airbnb &Vacation Rentals
- Real Estate Contracts
- Real Estate Information
- ADU-Accessory Dwelling Unit
- Agent Designations
- Agent Thank You
- Asbestos
- Avoid Water Damage
- Closing Costs
- Double Ending, Dual Agency
- Escrow Problems
- Flood Zones
- Implied Agency
- Liquefaction
- Mechanics Lien
- Mortgage Information
- Multiple Counter Offer
- New Homes
- Power Lines
- Preemptive Offer
- Property Line Fence Laws
- Property Ownership
- Property Taxes
- Proposition 19
- Real Estate Trends
- Recent Home Sales
- Removing Protected Trees
- Renting Out Condos (CIDs)
- SB 9 - CA Home Act
- Silicon Valley Schools
- 1.888% Selling Fee
- Blog
Home Values - Santa Clara Townouses
Average and Median Home Price of Santa Clara Townhouses Sold
When trying to understand Santa Clara neighborhood home values for townhouses, the first and most often real estate trend looked at is either average or median house sales price. The average price can be pushed up by a particularly expensive townhouse being sold. Much less often an especially low price for one or more townhouses can push the average price down. By looking at both average and median price a quick judgment can be made about any unusually high or low prices

Price Per Square Foot for Santa Clara Townhouses Sold
The sales price of a Santa Clara house is affected by its size. Looking at price per square foot gives a partial adjustment for differences between townhouses. Furthermore if you look at the average size of a Santa Clara townhouse sold you will see that it varies with time. Part of the variation is due to the random nature of which townhouses are being sold but the trend is for an increase in size with time because when a house is replaced with a newer townhouse, the newer townhouse is almost always larger.

Sales Price vs. List Price for Santa Clara Townhouses Sold
Home buyers and sellers want to know the typical relationship between list price and sales price. This relationship varies with city and time. The plots below show trends for this relationship using color coding which generally highlights changes in the market. More Santa Clara townhouses being sold over list price is a very good indicator of rising townhouse prices. More townhouses being sold under list price is a very good indicator of falling townhouse prices.

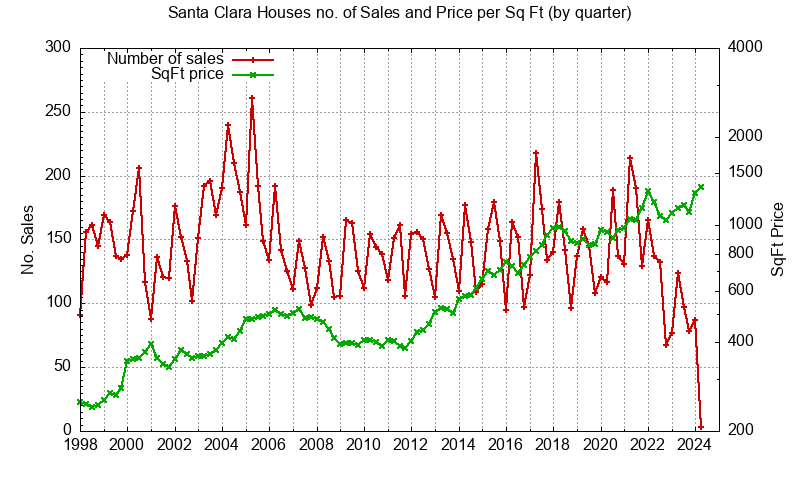
Number of Santa Clara Townhouses Sold
A quick estimate of how active the Santa Clara real estate market is can be found by looking at the number of townhouses sold. Locally there is a strong seasonal change in the number of townhouses sold. The lowest number of townhouses sold typically occurs around December & January. The highest number of townhouses sold typically occurs around May. Price changes do not track the seasonal change in the number of townhouses sold.

Santa Clara
Zip Code Prices
Juliana Lee Team - 650‑857‑1000
Please take a look at choosing a top Silicon Valley real estate agent.
[email protected] - 4260 El Camino Real, Palo Alto, CA
JLee Realty
Broker - Pinnacle Realty Advisors: 02220139 | Juliana Lee Team:70010194

Silicon Valley Real Estate and Homes For Sale
...
